Microsoft Excel is a popular spreadsheet software that is used by individuals, businesses, and organizations for a variety of purposes. Excel provides a range of features and tools that enable users to manage and analyze data, create charts and graphs, and perform complex calculations. In this article, we will discuss what MS Excel is, how to use it, and whether it is suitable for huge data calculations.

What is MS Excel?
Microsoft Excel is a spreadsheet software that is part of the Microsoft Office suite of applications. It was first released in 1985 and has since become one of the most widely used spreadsheet applications in the world. Excel allows users to organize, manipulate, and analyze data using a grid of cells arranged in rows and columns. The software can be used for a variety of tasks, including budgeting, financial analysis, data entry, and statistical analysis.
How to Use MS Excel?
Excel has a user-friendly interface that makes it easy for users to get started. When you open Excel, you are presented with a blank worksheet that contains a grid of cells. You can enter data into these cells by clicking on them and typing in the information. You can also use the keyboard to navigate between cells and enter data.
Excel provides a range of tools and features that enable users to manipulate and analyze data. For example, you can use formulas and functions to perform calculations on data, such as adding up numbers or calculating averages. Excel also allows you to sort and filter data, create charts and graphs, and use conditional formatting to highlight specific data points.
Can I Use MS Excel for Huge Data Calculations?
Excel is capable of handling large amounts of data, but there are some limitations to consider. The maximum number of rows and columns that Excel can handle is 1,048,576 rows by 16,384 columns, which should be sufficient for most users. However, if you are working with extremely large datasets, you may need to consider using other tools or software that are designed specifically for big data.
Excel can also be slow when working with large datasets, especially if you are using complex formulas or functions. In these cases, it may be necessary to optimize your Excel file by removing unnecessary formatting or using more efficient formulas.
Here’s an example of a data calculation using Excel:
Let’s say you have a list of products with their respective prices, and you want to calculate the total revenue using excel formulae’s. Here’s what you can do:
1. Create a new column called “Total Revenue” next to the “Price” column.
2. In the first cell of the “Total Revenue” column, enter the formula “=B2*C2” where “B2” refers to the cell containing the price of the first product and “C2” refers to the cell containing the quantity of the first product sold.
3. Press Enter to apply the formula to the first cell.
4. Hover your mouse over the bottom-right corner of the first cell until it turns into a small black cross.
5. Click and drag the small black cross down to apply the formula to the rest of the cells in the column.
6. The “Total Revenue” column should now be populated with the calculated revenue for each product.
7. To calculate the total revenue for all products, simply select the cells in the “Total Revenue” column and look at the bottom of the Excel window where the sum will be displayed.
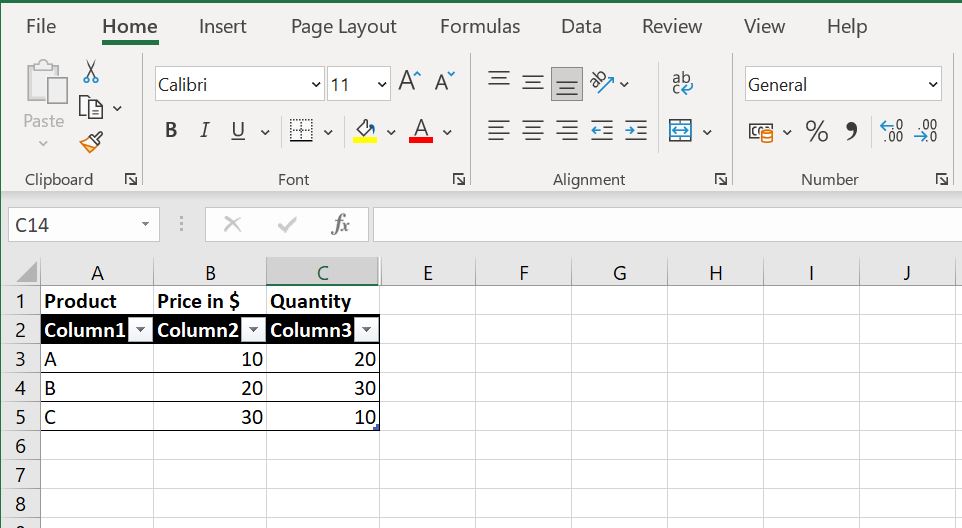
For example, let’s assume that you have the following data: 
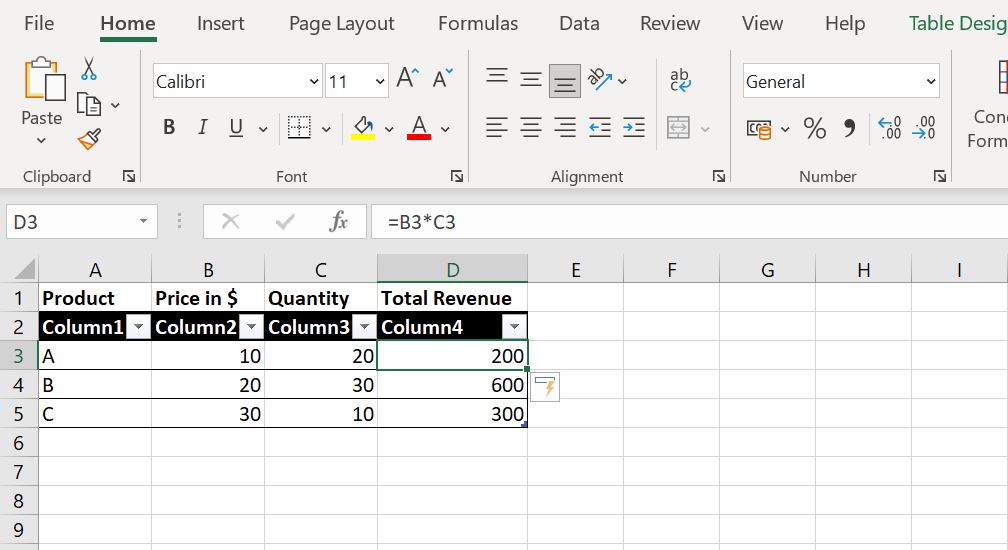
To calculate the total revenue, you would follow the steps above and end up with the following:
To calculate the total revenue for all products, you would select the cells in the “Total Revenue” and look at the sum at the bottom of the Excel window. The total revenue would be $1100.
Best practices for organizing and managing data in Excel:
Excel is a powerful tool for managing and analyzing data. However, with large amounts of data, it can be challenging to keep your data organized and easily accessible. In this article, we will explore the best practices for organizing and managing data in Excel.
1. Use a Consistent Structure
One of the best practices for organizing and managing data in Excel is to use a consistent structure. This means that your data should be organized in a way that is easy to understand and navigate. For example, you may want to use the same column headers for each data set or use a consistent naming convention for each worksheet.
By using a consistent structure, you can ensure that your data is easy to understand and navigate. This can help you to quickly find the information you need and make informed decisions based on your data.
2. Avoid Merged Cells
Merged cells can be problematic when organizing and managing data in Excel. When you merge cells, it can make it difficult to sort or filter data, or apply formulas or functions to your data. Additionally, merged cells can cause formatting issues, such as text wrapping or cell size discrepancies.
Instead of using merged cells, consider using a single cell for each piece of data. This can help to ensure that your data is easily sortable and filterable and can help to prevent formatting issues.
3. Use Data Validation
Data validation is a powerful tool in Excel that can help to prevent data entry errors. By using data validation, you can set up rules for your data, such as minimum and maximum values, or specific text or number formats.
Using data validation can help to ensure that your data is accurate and consistent. It can also save you time by preventing the need to manually correct data entry errors.
4. Use Formatting to Highlight Important Information
Excel provides a range of formatting options that can help to highlight important information in your data. For example, you can use conditional formatting to highlight cells that meet specific criteria or use color coding to differentiate between different types of data.
By using formatting to highlight important information, you can quickly identify trends or patterns in your data. This can help you to make informed decisions based on your data.
5. Use PivotTables and Pivot Charts
PivotTables and Pivot Charts are powerful tools in Excel that can help to summarize and analyze large amounts of data. PivotTables allow you to summarize data by category, such as by date or product, while Pivot Charts allow you to visualize your data in a variety of chart types.
Using PivotTables and Pivot Charts can help you to quickly analyze and summarize large amounts of data. This can help you to make informed decisions based on your data and can save you time by reducing the need to manually analyze and summarize your data.
6. Use Macros to Automate Tasks
Excel provides a range of automation tools, including macros, that can help to save you time and reduce the risk of data entry errors. Macros are small programs that can automate repetitive tasks, such as data entry or formatting.
Using macros can help to automate tedious or time-consuming tasks, which can help you to be more productive and reduce the risk of errors. However, it is important to be cautious when using macros, as they can also introduce security risks if not used properly.
At Last, but not least
Organizing and managing data in Excel can be a challenging task, especially with large amounts of data. However, by following these best practices, you can ensure that your data is organized, accurate, and easily accessible. By using a consistent structure, avoiding merged cells, using data validation, using formatting to highlight important information, using PivotTables and Pivot Charts, and using macros to automate tasks, you can make the most of Excel’s powerful data management and analysis capabilities.